
01
Connect approved sources
Configure connections to supported SQL databases, Excel or CSV files, and documented APIs within the selected deployment.
BOST Service
OneManAI is an AI- and BI-enabled decision-intelligence platform designed to bring supported databases, files and documented APIs into one analytical workspace. Subject to configuration and data readiness, teams can ask questions in natural language and prepare reviewable results that support more informed decisions.
Delivered by BOST
From data to decisions
Organizations generate large volumes of information across disconnected systems, yet reporting can remain slow, dependent on individuals and limited by an incomplete view of the business.
OneManAI is designed to connect client-approved, supported organizational sources in a configurable analytical workspace. Its AI can help analyze connected data and surface possible patterns and relationships, while users remain responsible for reviewing outputs before using them in business decisions.
Connected sources
 AI + BI
Inspectable results ready for reusable dashboards
Visual BI results
Move from connected evidence to the comparison, segment, hierarchy or map that makes the answer clear.
Core workflow
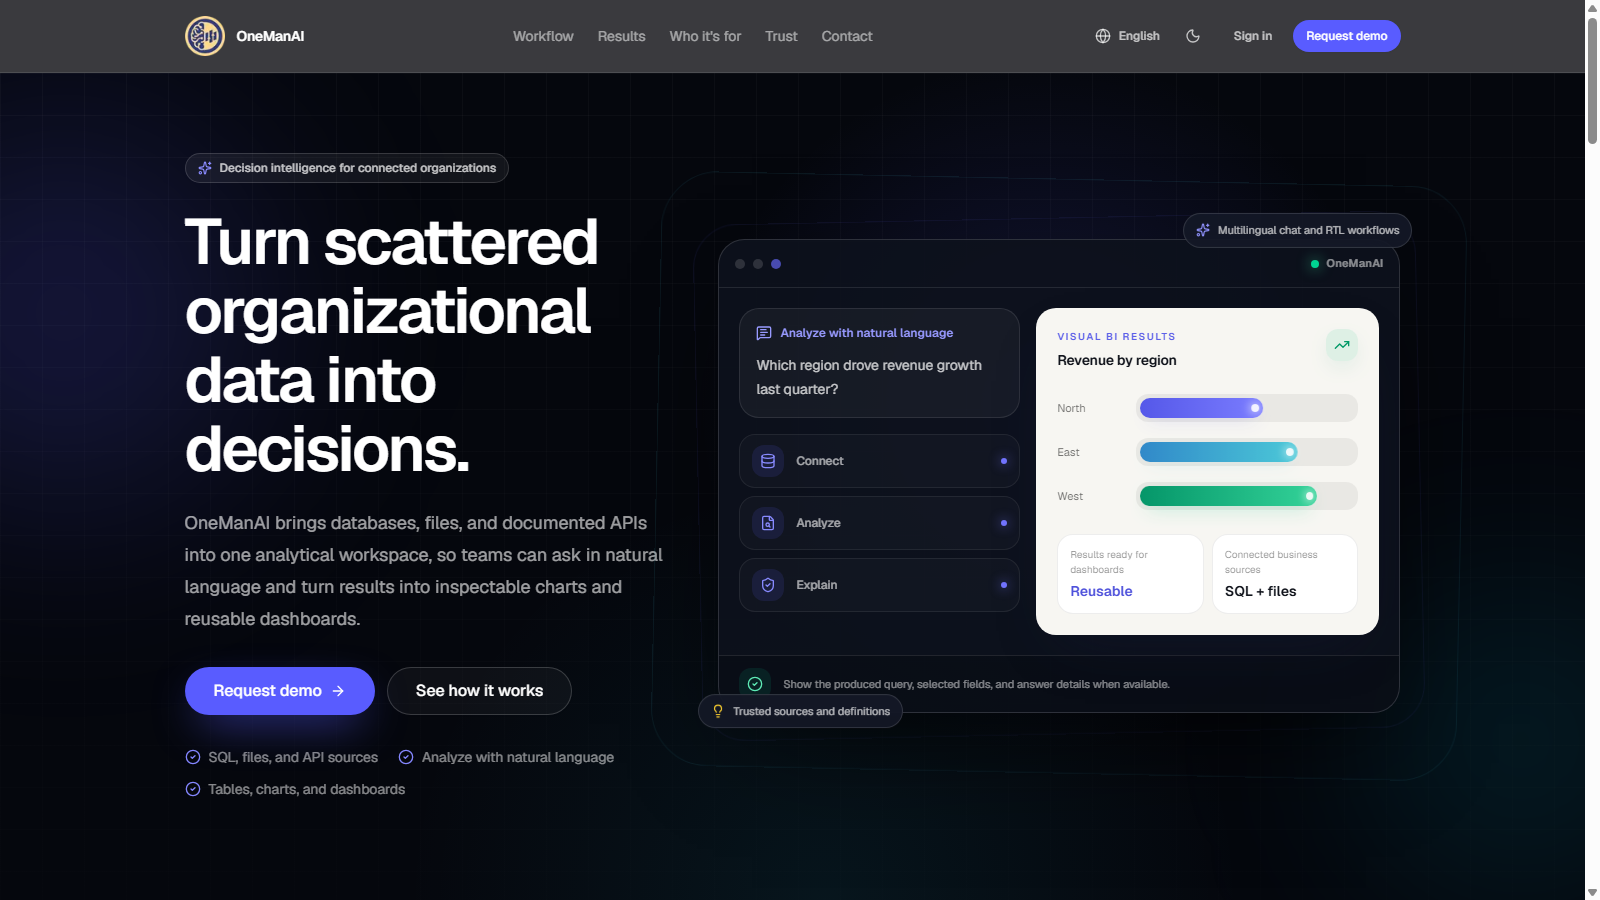
Use supported sources your organization already relies on, analyze them through conversation, and preserve reviewed results for reuse.
Configure connections to supported SQL databases, Excel or CSV files, and documented APIs within the selected deployment.
Ask management or operational questions and compare trends, segments, regions and business units using connected data.
Review generated queries and source details, then save and share charts or reusable dashboards and export supported dashboards to PDF.
Visual BI results
Move from connected evidence to the comparison, segment, hierarchy or map that makes the answer clear.
Compare revenue, growth and performance across regions or business units.
Map local or country-level metrics whenever location is material to the decision.
Group customers and identify meaningful differences in account behavior.
Break a management result down by department, category, site or owner.
Enterprise use cases
Analyze production, quality, maintenance, inventory, supplier and site data from connected databases, files and APIs.
Bring sales, customer service, finance, billing, project and time data together to understand delivery and client performance.
Ask questions about budgets, programmes, service requests and regional outcomes with explainable results for internal teams.
Control and transparency
Available controls depend on the agreed deployment and configuration. Users should review source details, queries and outputs before relying on a result.
Where enabled in the selected deployment, owner, administrator, editor and viewer roles can define what each member may manage or change.
Inspect the generated query, selected fields and answer details when they are available.
Keep preferred sources and business vocabulary close to reusable evidence and dashboards.
Capabilities depend on the selected deployment, configured connectors, source quality and user permissions. AI-generated analysis may be incomplete or incorrect and requires human validation. Security, hosting, retention and integration requirements are confirmed during solution scoping.
Show us the source types behind your question. We will demonstrate how OneManAI turns connected evidence into an inspectable chart or reusable dashboard.